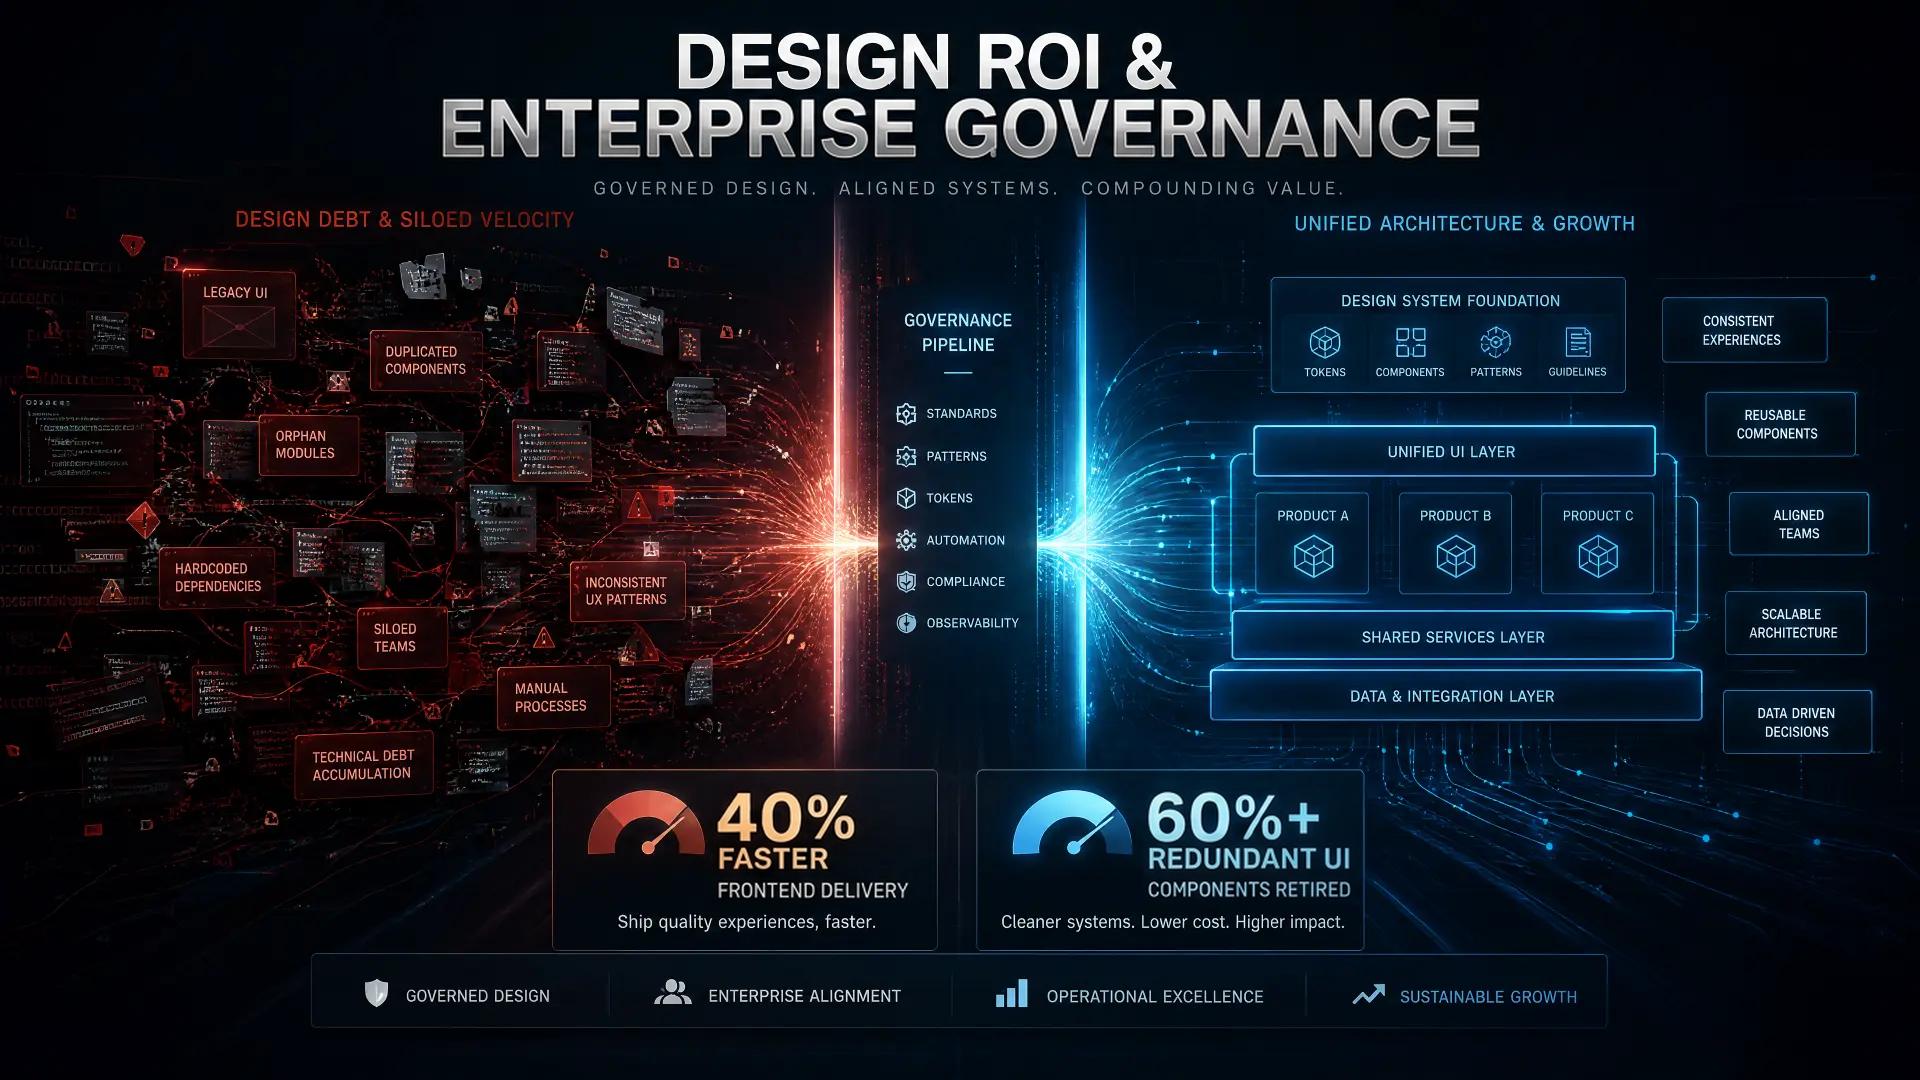
DESIGN ROI & ENTERPRISE GOVERNANCE: LINKING UX VELOCITY TO TOP-LINE GROWTH
Design ROI is an operational velocity metric, not a measure of visual polish. This is how I used enterprise design systems, component tokenization, and cross-functional governance to connect UX velocity directly to bottom-line cost reduction and top-line growth for an enterprise client (anonymized as Synapse). Synapse is a JRA client, anonymized here under NDA.
Synapse: The Enterprise Nervous System, the platform ecosystem this operating model was built for.
Velocity is the return, polish is the byproduct.
Enterprise organizations rarely lose to bad visual design. They lose to the compounding cost of rebuilding the same interface logic in a dozen places, then paying to keep every copy in sync. The premise here is simple: when design is architected as shared infrastructure, every downstream team moves faster, and that speed is measurable in dollars.
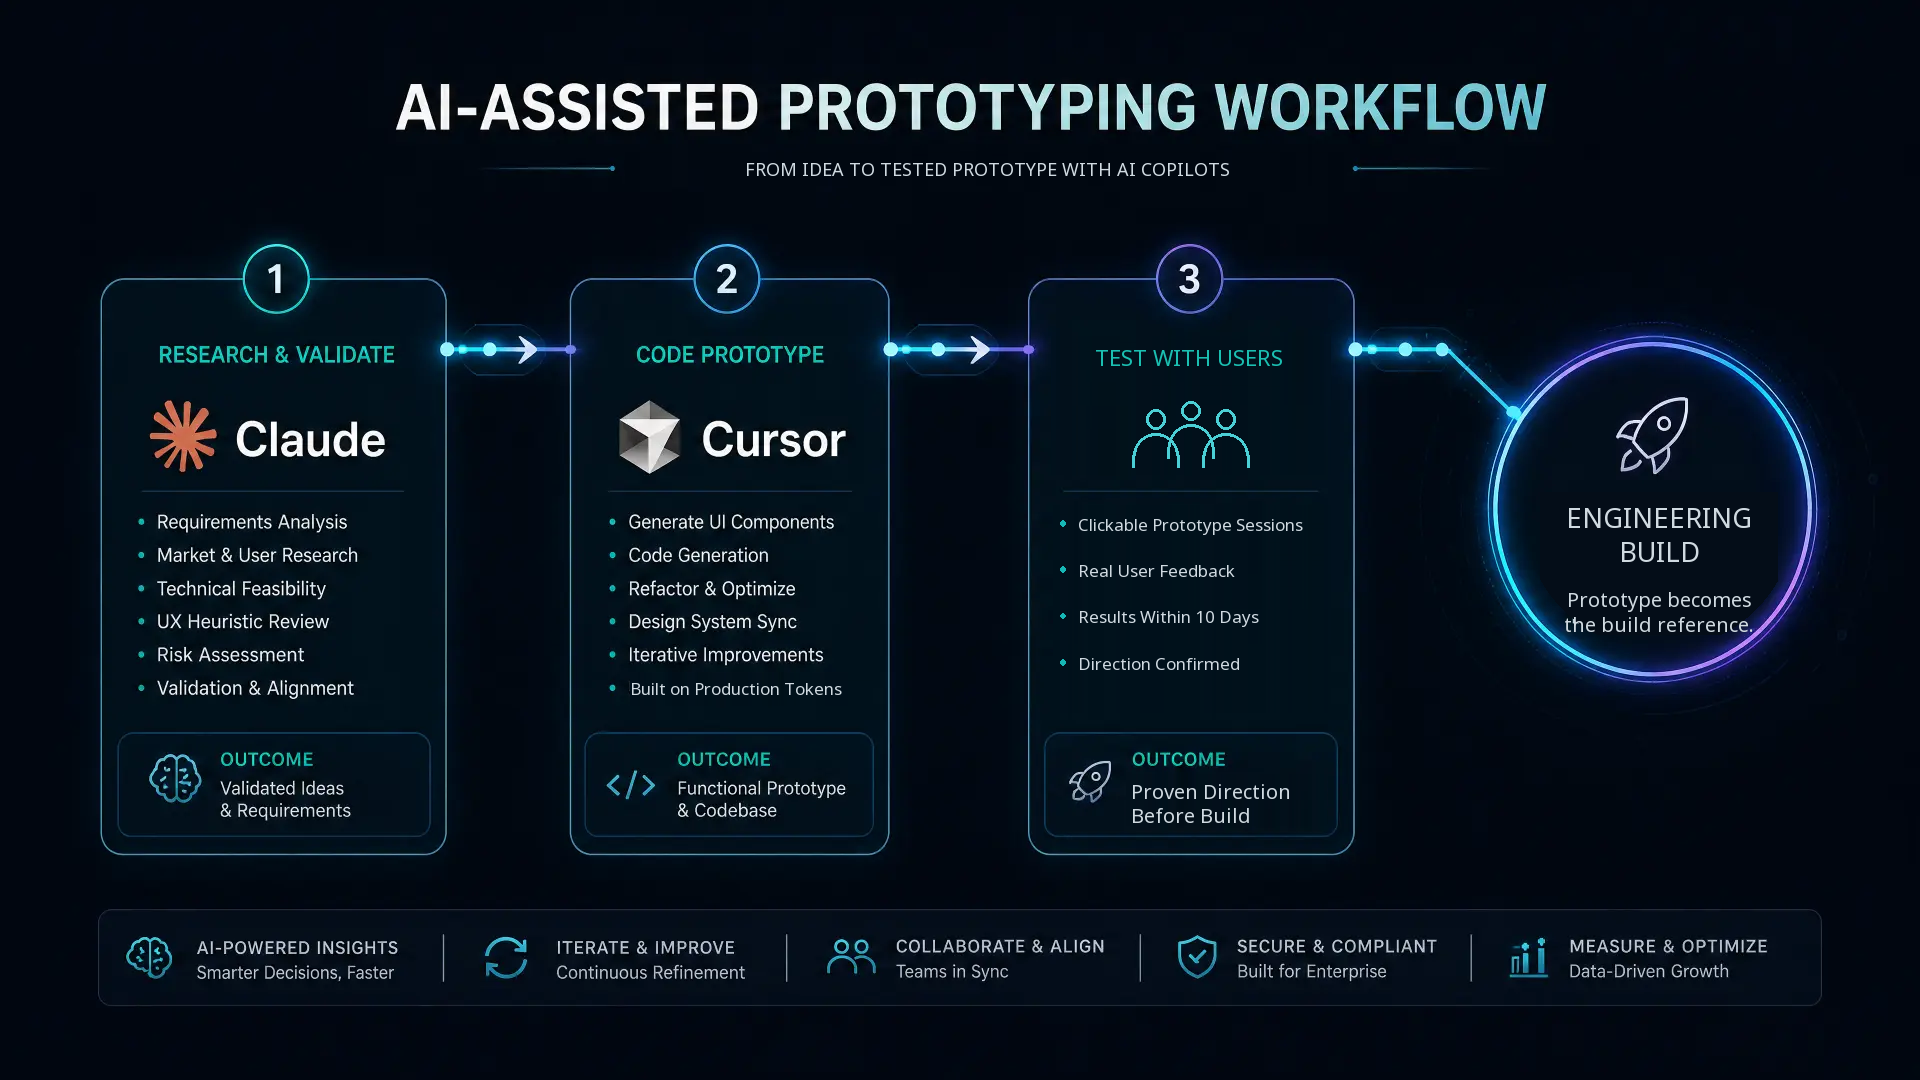
Across the Synapse platform, I structured the work as three connected investments, a tokenized architecture that removes redundant build, a governance model that removes redundant debate, and a prototyping system that removes redundant guessing. Together they turn design from a service queue into a throughput multiplier the business can forecast against.
Identifying enterprise design debt.
Before any system work started, three liabilities were draining velocity across every product line.
The Component Redundancy Trap
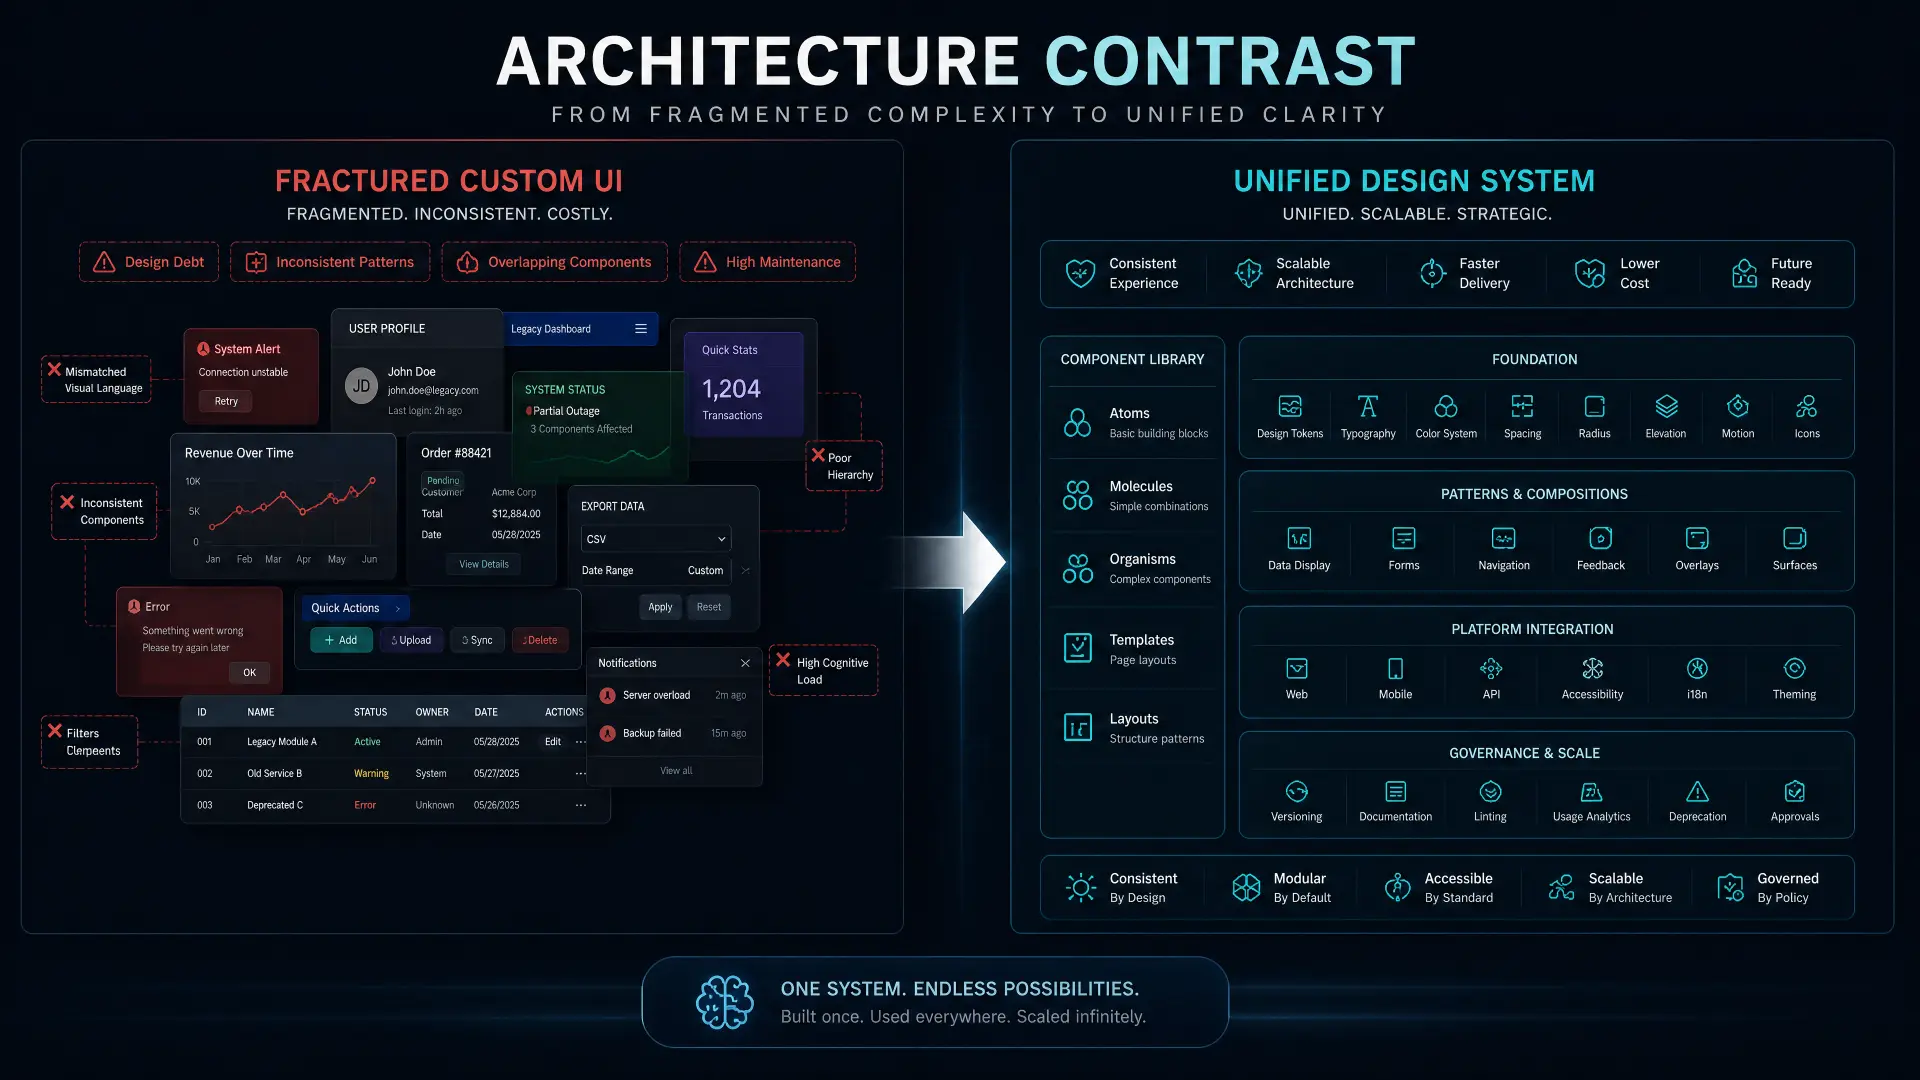
With no tokenized foundation, every squad custom built its own buttons, tables, and modals. The result was code bloat, visual drift across workflows, and a maintenance bill that grew with every release rather than shrinking.
Decoupled Decision Rights
Design was treated as an aesthetic layer applied late rather than an architectural discipline defined early. Acceptance criteria arrived after build, which turned every handoff into a negotiation and every sprint into a revision loop.
Opaque ROI Metrics
UX sat in the budget as a cost center with no instrumentation tying it to delivery speed, retention, or expansion revenue. Without a measurable line to business outcomes, design lost the argument for investment before it started.
From lo-fi wireframes to hi-fi execution.
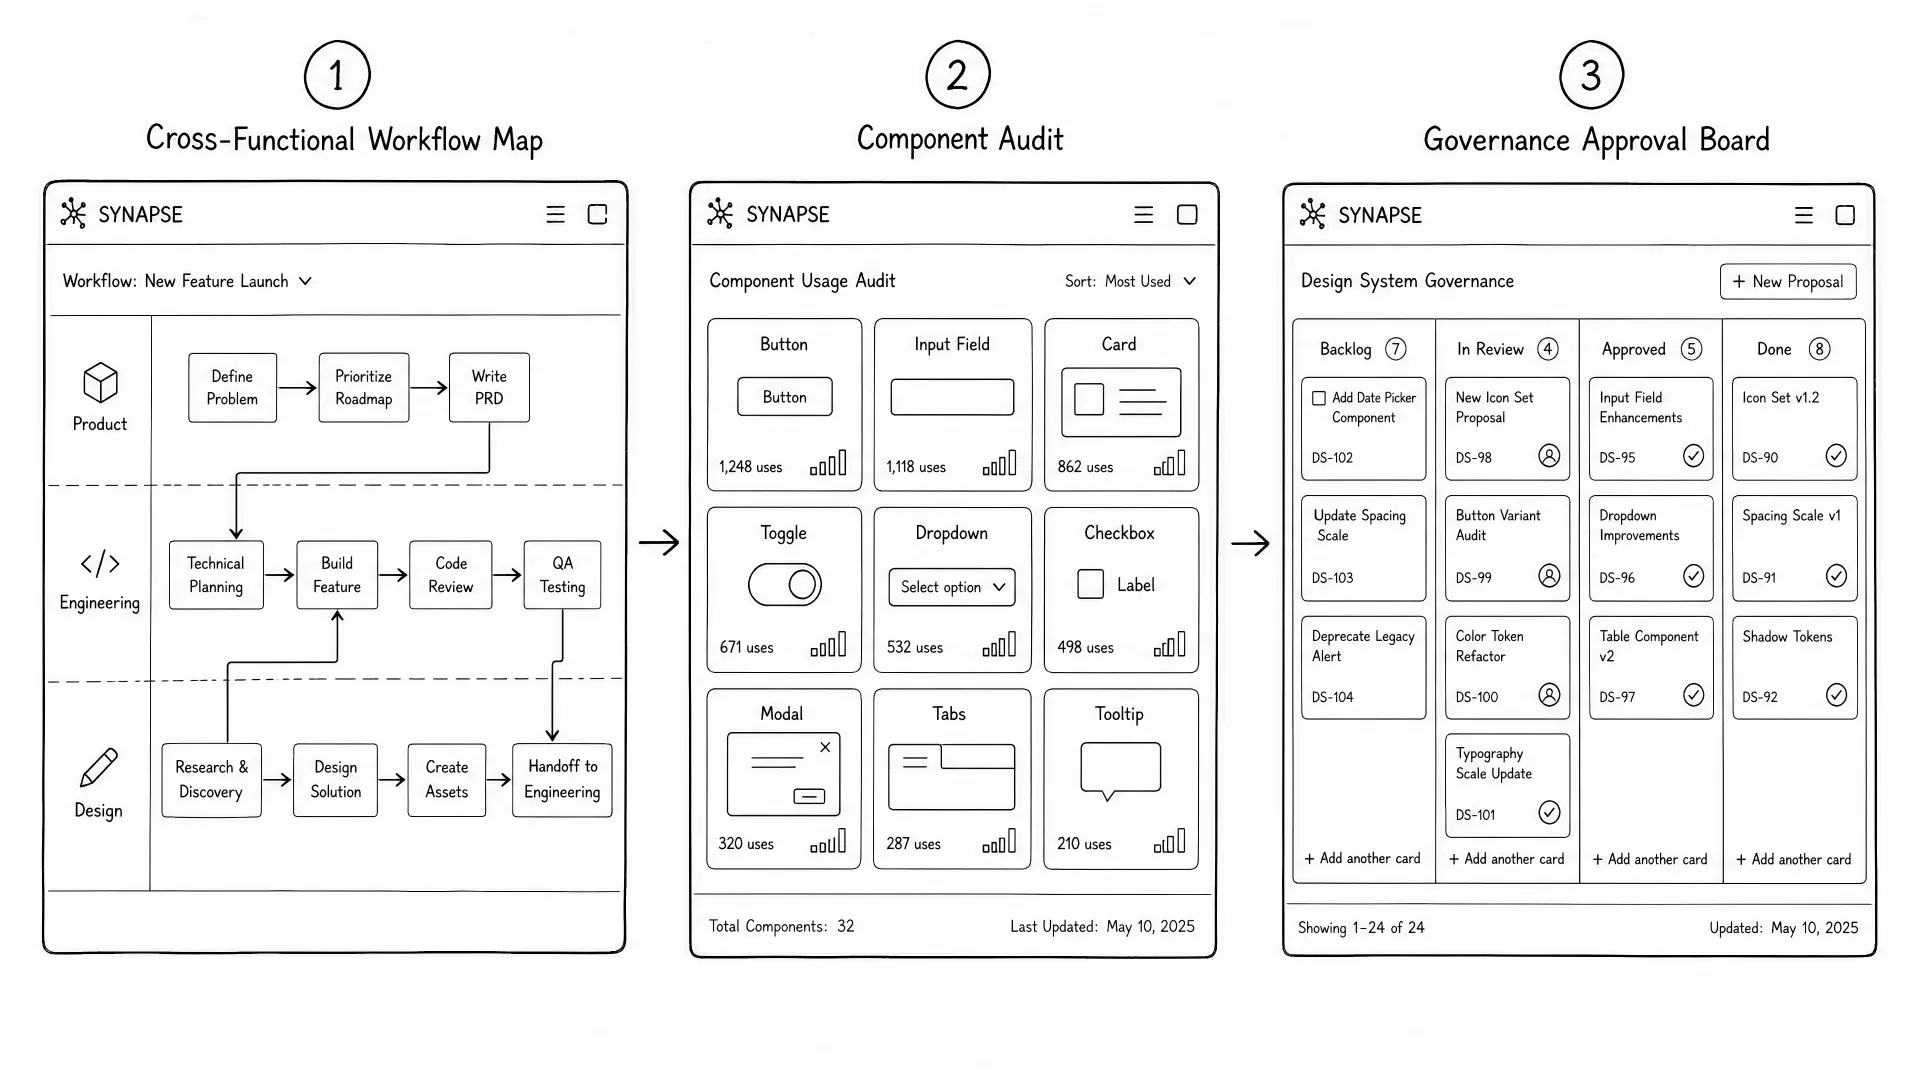
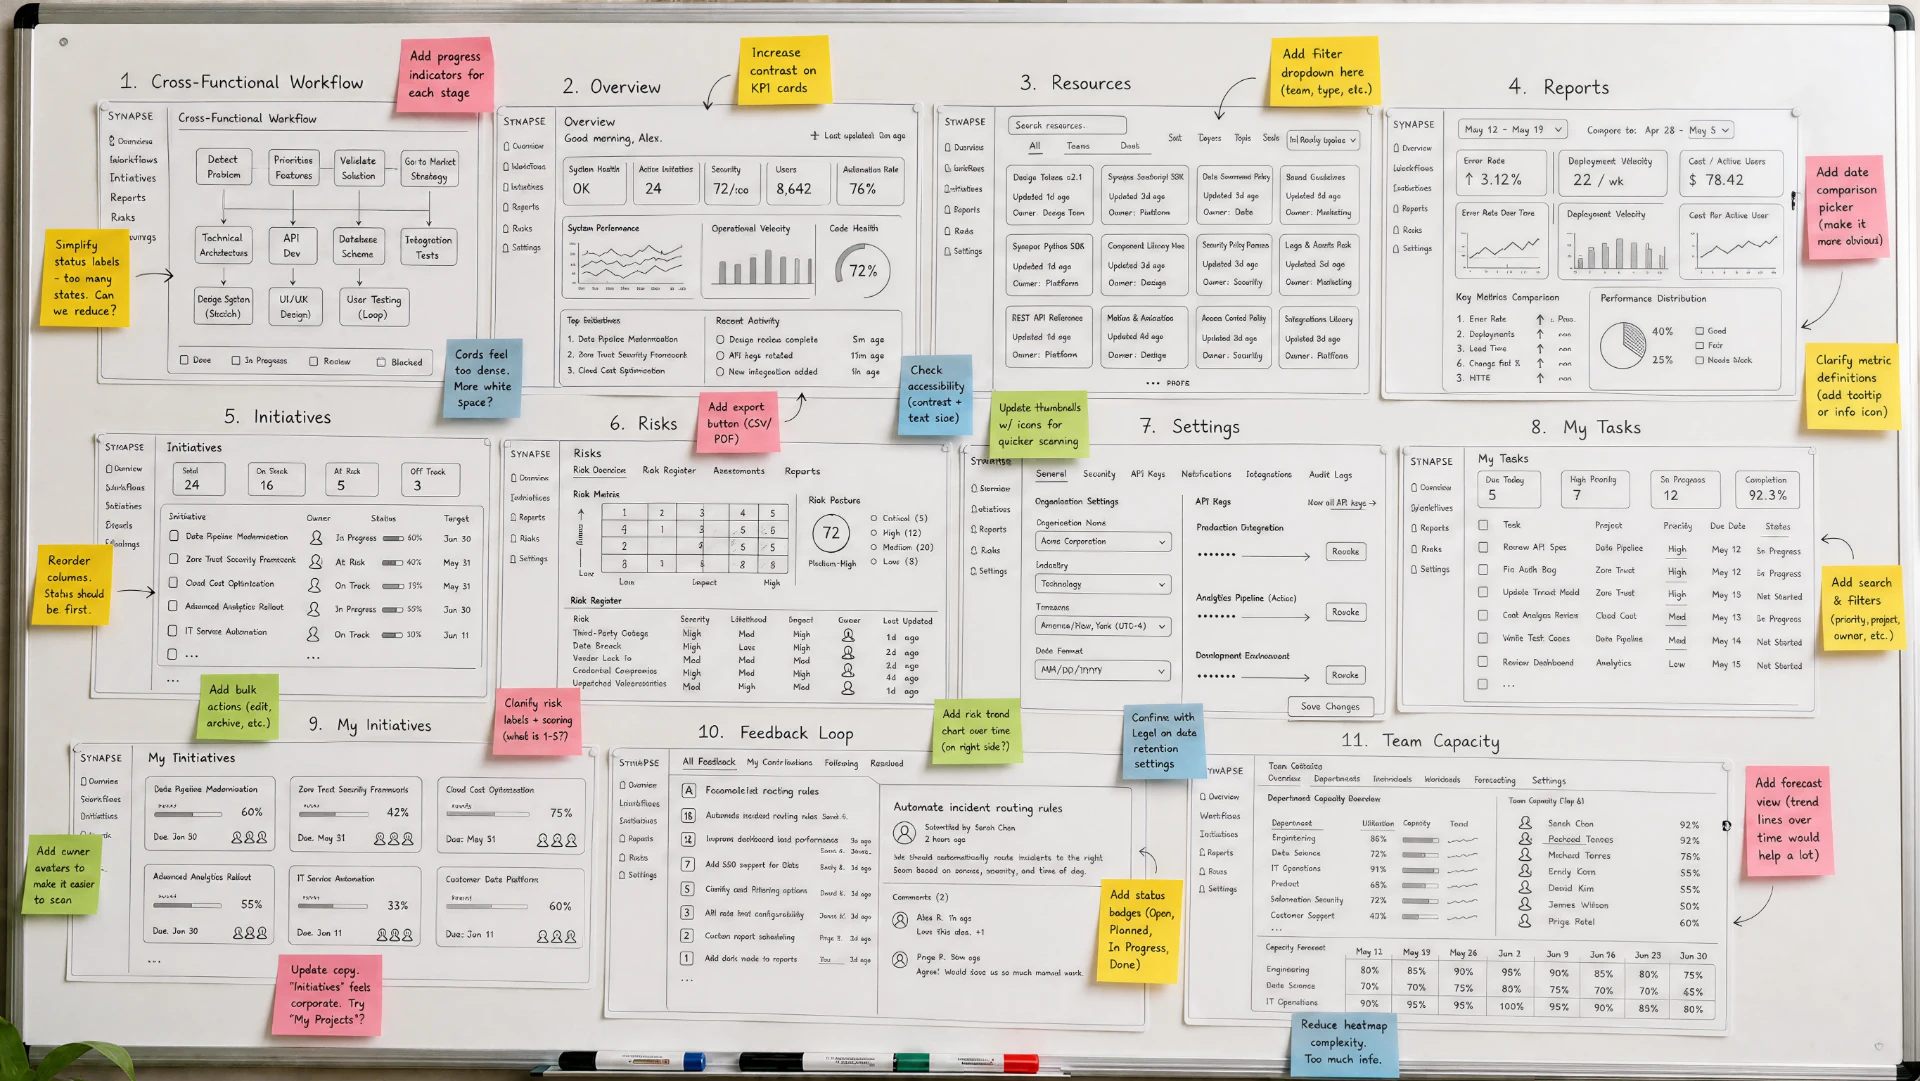
Structure was resolved on the whiteboard, at the cheapest possible moment. Information architecture, swimlane logic, and navigation hierarchy were argued out in low fidelity, so the high fidelity suite could be produced directly on production tokens rather than redrawn from scratch.
Lo-Fi Wireframe Stage
Whiteboard flows and grayscale frames mapped the module set, the swimlane model, and the shortcuts rail before a single component was styled.
Token Application
Approved structure was rebuilt on the tokenized library, so color, type, spacing, and elevation came from the system rather than from a file.
Hi-Fi Operational Suite
Eleven production grade surfaces were generated on the same foundation, each one usable as an implementation reference for engineering.
Structure, sequence, and governance logic resolved in low fidelity.
Browse the generated Synapse operational screens.
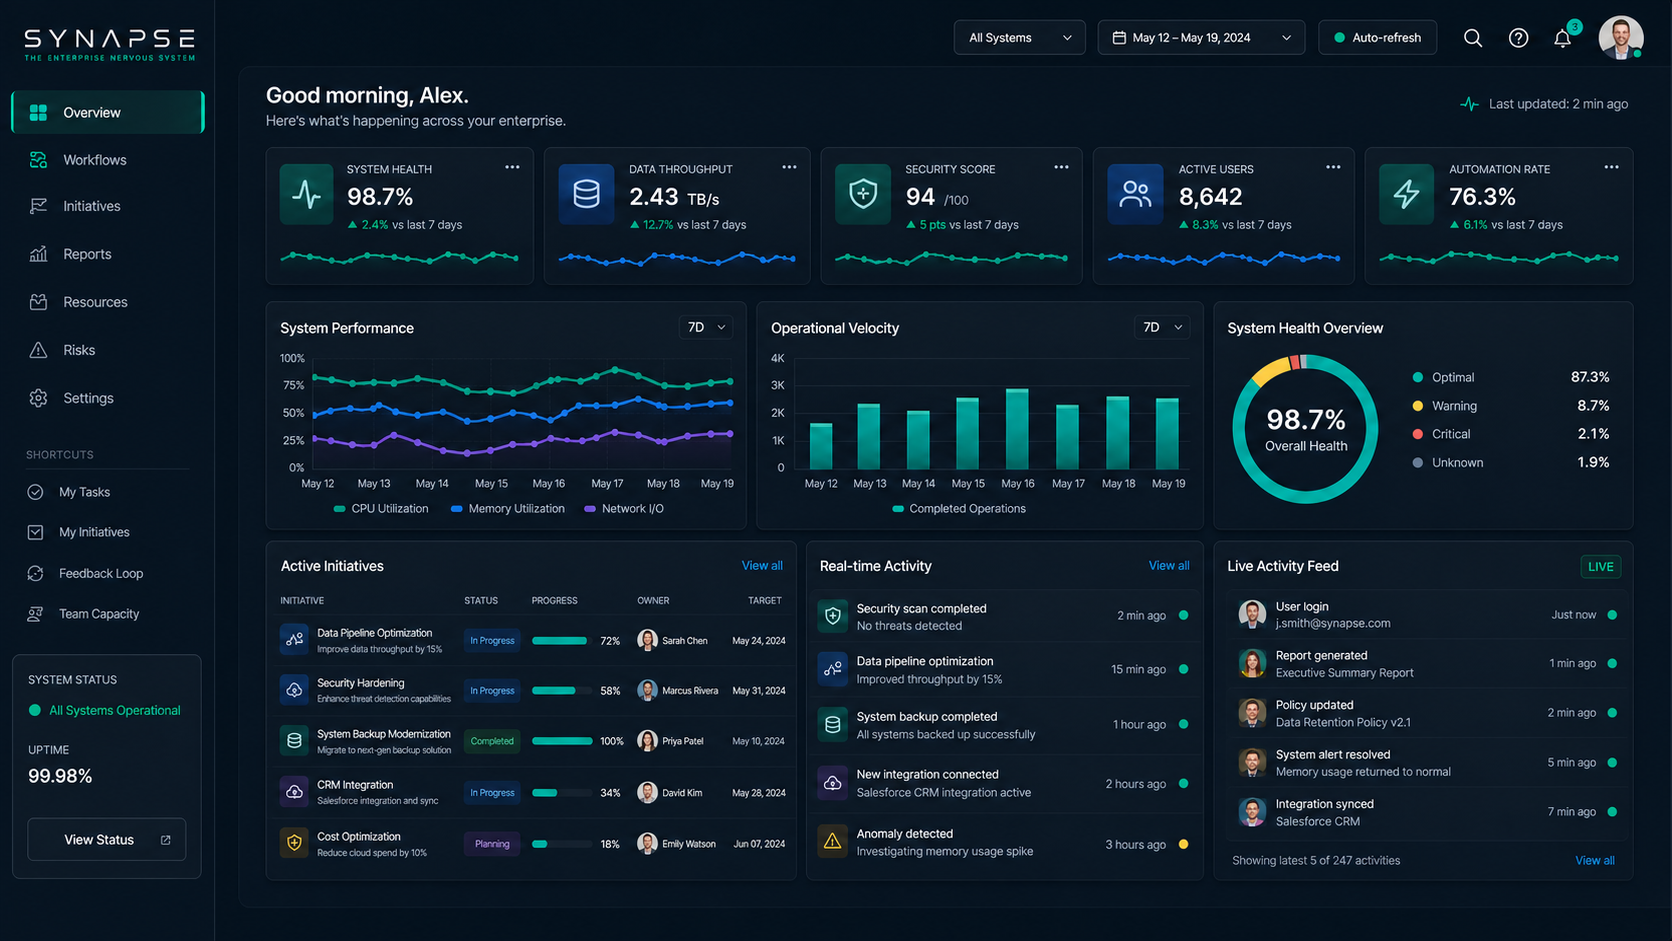
Overview. The executive command surface, system health, throughput, and live activity in one glance.
Scaling design systems and governance.
A three tier operating model, sequenced so each tier makes the next one cheaper to run.
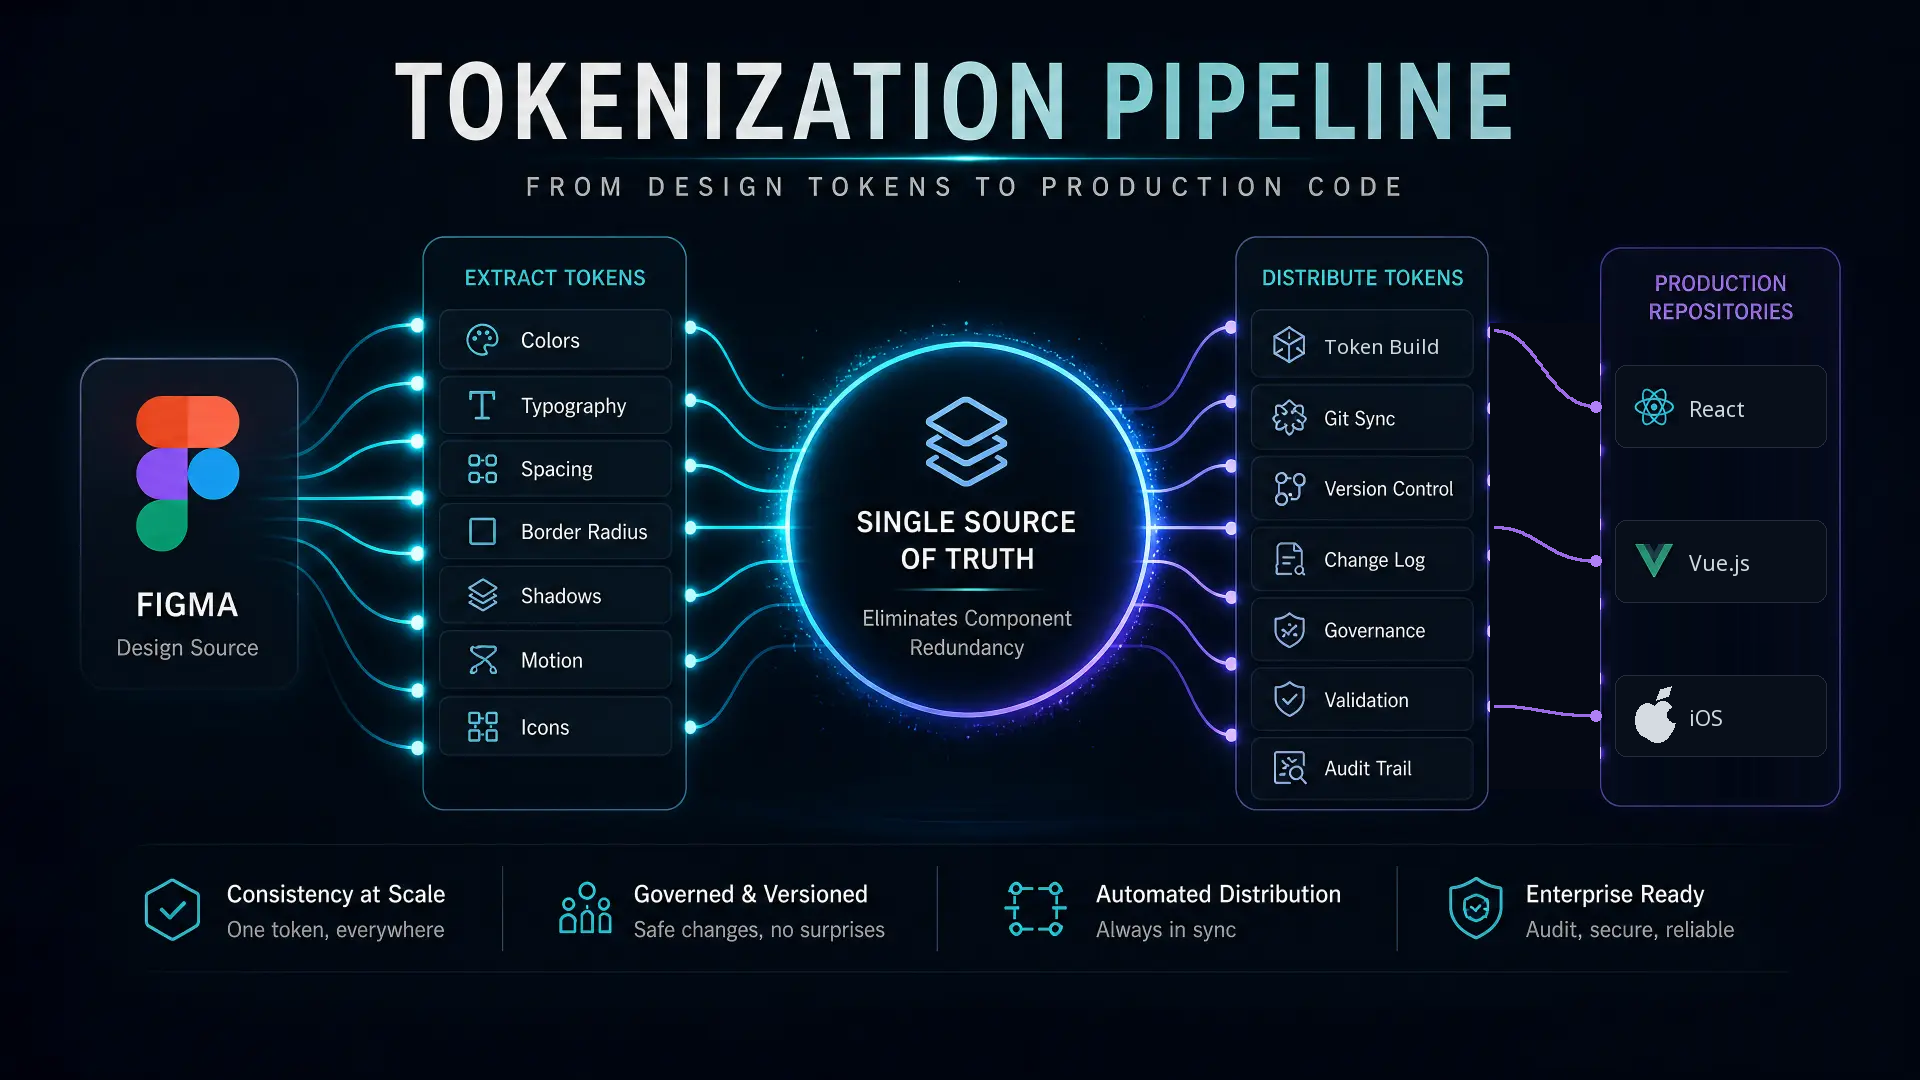
Tokenized Design Architecture
A single source of truth running from Figma variables straight into code tokens, with standardized component libraries versioned like any other platform dependency. Color, type, spacing, and elevation stopped being opinions and became infrastructure.
- Figma to code token parity, published as a versioned package
- One shared component library across Synapse's web and iOS products
- Deprecation paths so legacy patterns retire on a schedule, not by accident
What changed, and how we measured it.
Less rebuilding, more building
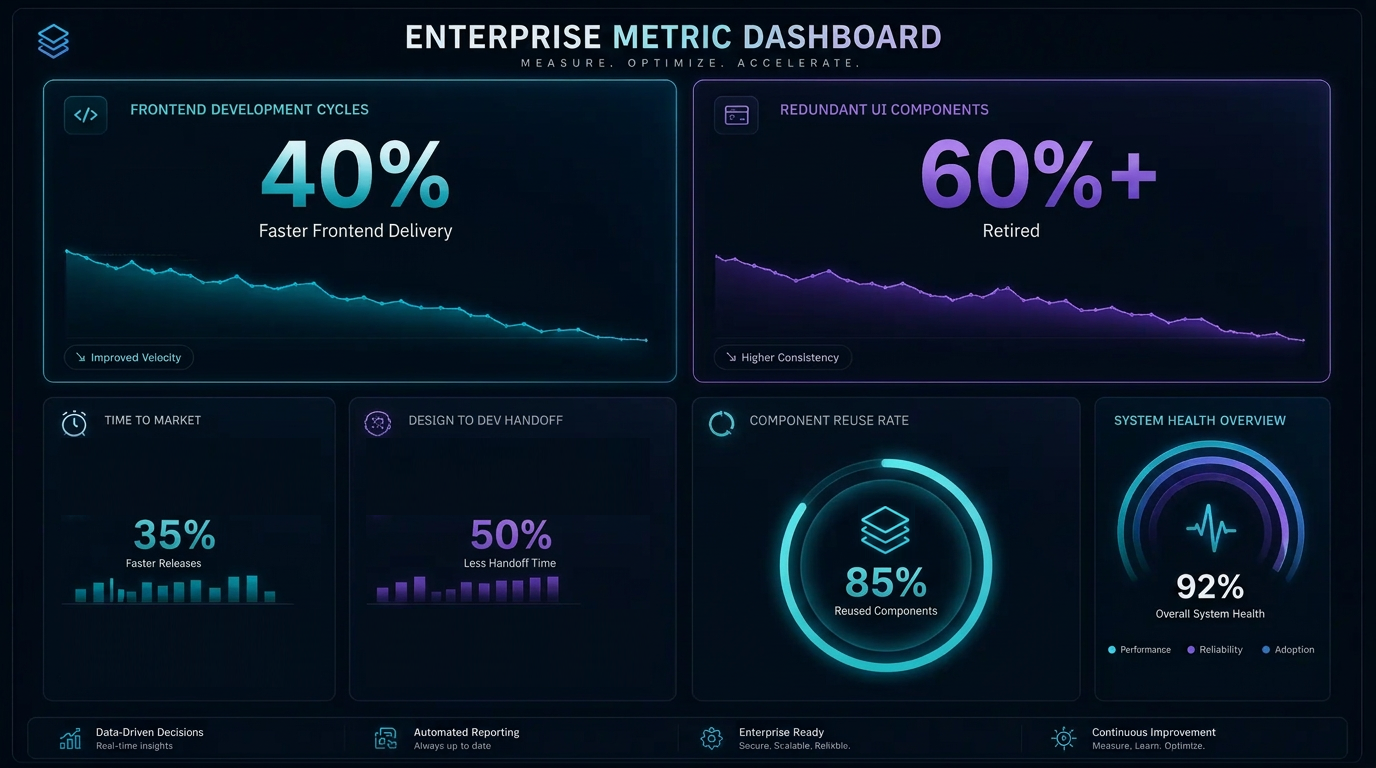
Before the system, every new workflow meant rebuilding buttons, forms, and tables that already existed somewhere else. With one shared library, frontend delivery got 40% faster, and engineers spent that time on the features that actually set the product apart.
Less to maintain
We retired more than 60% of redundant UI components. Fewer versions of the same thing meant a platform wide change became one edit instead of a cleanup project.
Faster to market
With handoff time cut in half and most new screens built from existing parts, new workflows reached customers 35% faster. Design stopped being a step teams waited on and became part of how they shipped.